Digital Analytics

How Does It Work?

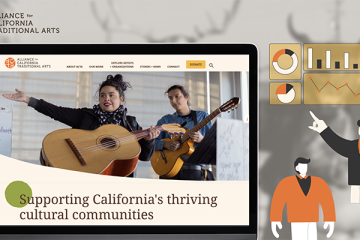
Students work in small teams to analyze your organization's analytics data to identify insights and make recommendations to improve retention and engagement.

Project Duration: Half semester (7-8 weeks)
Availability: Fall and Spring
Ideal For: Organizations who can provide access to their website or mobile app analytics tools (e.g., Google Analytics, Flurry) and engagement data from their social media platforms (e.g. Facebook Insights, Twitter Analytics, Iconosquare, YouTube Analytics, etc.).

What You Get: A formal analytics report and a data dashboard or infographic

Project Process

01

Stakeholder Interview

Interview client stakeholder(s) to understand organizational needs/goals and identify target audiences.

02

Data Collection & Analysis

Choose relevant metrics and examine analytics data to identify user engagement trends and patterns.

03

Data Visualization

Create visual summaries and/or interactive visualizations to communicate key findings.

Interested in Digital Analytics projects? Let us know!

Case Studies: Digital Analytics

Digital Analytics

Inspired Minds Art Center Digital Presence Optimization

by Sandra Ye

Digital Analytics

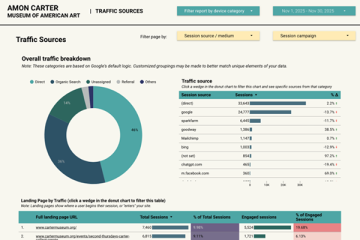
Transforming Museum Analytics into Strategic Action

by Kai-Chieh Huang

Digital Analytics

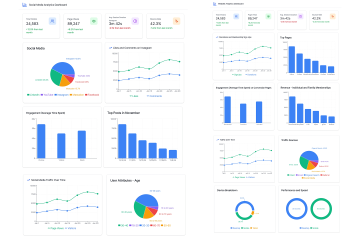
Helping the Peale Museum track their digital analytics growth through curated dashboards

by Aayushi Bharadwaj

Digital Analytics

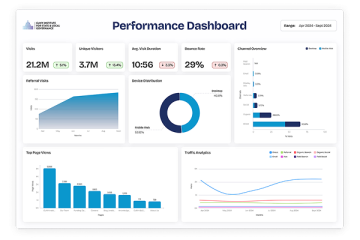
Analyzing digital analytics to uncover pain points and increase organic visits through SEO optimization for a think-and-do tank

by Gerard Samson

Digital Analytics

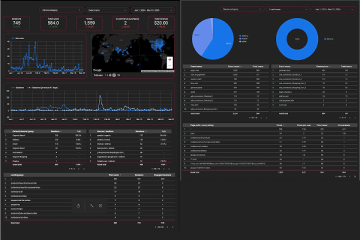
Optimizing Happy’ N Beyond’s Website Performance and Engagement Strategies

by Rui Tian

Digital Analytics

Analyzing Data to Refine the ACTA’s Digital Strategy

by Yiying Zhou