Digital Analytics

How Does It Work?

Students work in small teams to analyze your organization's analytics data to identify insights and make recommendations to improve retention and engagement.

Project Duration: Half semester (7-8 weeks)
Availability: Fall and Spring
Ideal For: Organizations who can provide access to their website or mobile app analytics tools (e.g., Google Analytics, Flurry) and engagement data from their social media platforms (e.g. Facebook Insights, Twitter Analytics, Iconosquare, YouTube Analytics, etc.).
What You Get: A formal analytics report and a data dashboard or infographic

Project Process

01

Stakeholder Interview

Interview client stakeholder(s) to understand organizational needs/goals and identify target audiences.

02

Data Collection & Analysis

Choose relevant metrics and examine analytics data to identify user engagement trends and patterns.

03

Data Visualization

Create visual summaries and/or interactive visualizations to communicate key findings.

Interested in Digital Analytics projects? Let us know!

Case Studies: Digital Analytics

Digital Analytics

Using Data Analytics to Determine If Pratt Institute’s New Website Is Successful In Catering to Its Site Visitors

by Leewon Seo

Digital Analytics

Enhancing User Engagement and Discoverability Across The New School Archives Platforms

by Nahee Kim

Digital Analytics

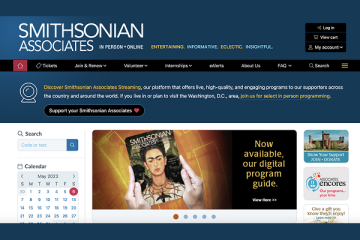
Optimizing User Experience and Engagement on Smithsonian Associates’ Website via Universal Analytics and GA4

by Brianna Casas

Digital Analytics

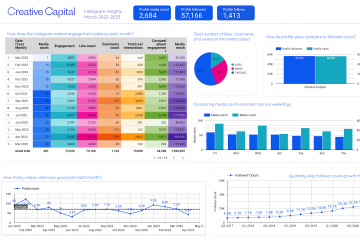
Art Meets Data: Enhancing Creative Capital’s impact through analytics-driven insights for optimized digital Reach and Engagement

by Priyanka Jain

Digital Analytics

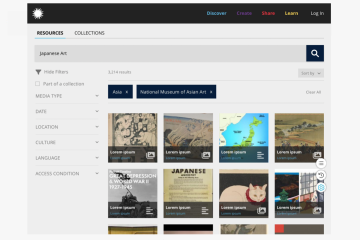
Understanding Search in the Smithsonian Learning Lab

by Tess Porter

Digital Analytics

Using web analytics to help a family-owned hair and body care business increase revenue

by Danielle Kingberg