Digital Analytics

How Does It Work?

Students work in small teams to analyze your organization's analytics data to identify insights and make recommendations to improve retention and engagement.

Project Duration: Half semester (7-8 weeks)
Availability: Fall and Spring
Ideal For: Organizations who can provide access to their website or mobile app analytics tools (e.g., Google Analytics, Flurry) and engagement data from their social media platforms (e.g. Facebook Insights, Twitter Analytics, Iconosquare, YouTube Analytics, etc.).
What You Get: A formal analytics report and a data dashboard or infographic

Project Process

01

Stakeholder Interview

Interview client stakeholder(s) to understand organizational needs/goals and identify target audiences.

02

Data Collection & Analysis

Choose relevant metrics and examine analytics data to identify user engagement trends and patterns.

03

Data Visualization

Create visual summaries and/or interactive visualizations to communicate key findings.

Interested in Digital Analytics projects? Let us know!

Case Studies: Digital Analytics

Digital Analytics

Using digital analytics to help Ingenium understand how their new website is performing

by Elisabeth Pefanis

Digital Analytics

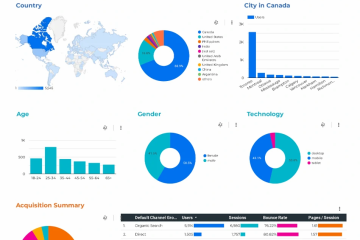
Increasing user engagement and reducing the exit rate for the Mural Map of Canada website

by Siddhart Rajendra

Digital Analytics

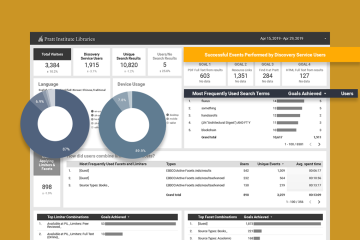
Creating a data dashboard for Pratt Institute Libraries to improve users’ search experience

by Hyerim Hwang

Digital Analytics

Analyzing User Engagement with Lincoln Center on Facebook

by Alexandra Jacinto